Note
Go to the end to download the full example code.
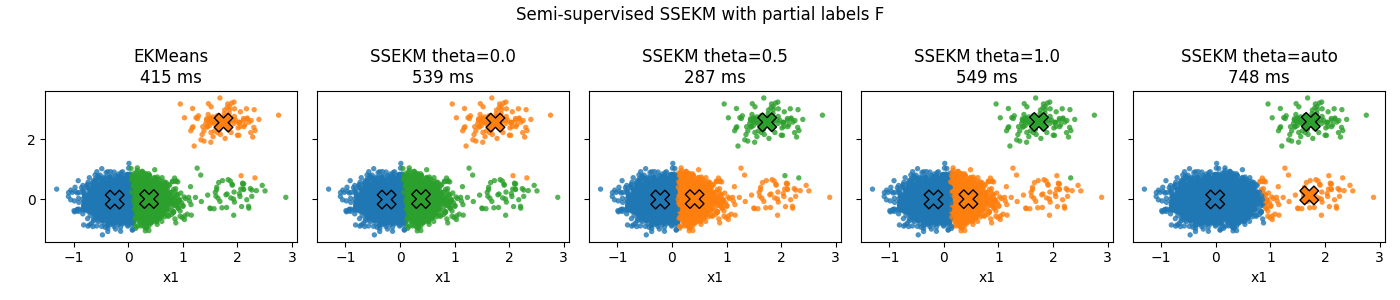
Semi-supervised SSEKM on a toy dataset#
This example shows how to use SSEKM with partial labels provided via matrix F. We label a few samples and vary theta to control the influence of supervision.
import time

import matplotlib.pyplot as plt
import numpy as np
from matplotlib.colors import ListedColormap

from sklekmeans import SSEKM, EKMeans


def make_toy(seed=0):
    rng = np.random.RandomState(seed)
    X1 = rng.normal(loc=[0, 0], scale=0.35, size=(4000, 2))
    X2 = rng.normal(loc=[2.0, 0.2], scale=0.35, size=(50, 2))
    X3 = rng.normal(loc=[1.7, 2.6], scale=0.35, size=(100, 2))
    X = np.vstack([X1, X2, X3])
    return X


X = make_toy(0)
K = 3

# Create partial labels: mark first 300 points as class 0, next 20 as class 1, next 20 as class 2
F = np.zeros((X.shape[0], K), dtype=float)
F[:300, 0] = 1.0
F[4000:4020, 1] = 1.0
F[4050:4070, 2] = 1.0

# Baseline EKMeans
start = time.time()
ekm = EKMeans(n_clusters=K, random_state=0, n_init=3)
ekm.fit(X)
t_ekm = time.time() - start

# SSEKM with different thetas
results = []
for theta in [0.0, 0.5, 1.0, "auto"]:
    start = time.time()
    sse = SSEKM(n_clusters=K, random_state=0, n_init=3, theta=theta)
    sse.fit(X, prior_matrix=F)
    t = time.time() - start
    results.append((theta, sse, t))

# Plot
cmap = ListedColormap(["#1f77b4", "#ff7f0e", "#2ca02c"])
fig, axes = plt.subplots(1, 5, figsize=(14, 3), sharex=True, sharey=True)
axes = axes.ravel()


def scatter_with_centers(ax, X, labels, centers, title):
    ax.scatter(
        X[:, 0], X[:, 1], c=labels, s=15, cmap=cmap, alpha=0.8, edgecolors="none"
    )
    ax.scatter(
        centers[:, 0],
        centers[:, 1],
        c=np.arange(K),
        s=180,
        marker="X",
        cmap=cmap,
        edgecolors="k",
        linewidths=1.0,
    )
    ax.set_title(title)
    ax.set_xlabel("x1")


# Plot EKMeans
labels_ekm = ekm.predict(X)
scatter_with_centers(
    axes[0], X, labels_ekm, ekm.cluster_centers_, f"EKMeans\n{t_ekm*1e3:.0f} ms"
)

# Plot SSEKM results
for ax, (theta, sse, t) in zip(axes[1:], results):
    labels = sse.predict(X)
    title = f"SSEKM theta={theta}\n{t*1e3:.0f} ms"
    scatter_with_centers(ax, X, labels, sse.cluster_centers_, title)

fig.suptitle("Semi-supervised SSEKM with partial labels F")
fig.tight_layout()
plt.show()
Total running time of the script: (0 minutes 2.945 seconds)